Last week, we shipped a surprise update to Vapor that allows you to interact with your application logs directly from the Vapor dashboard.
Before the paint has even had time to dry on that feature, we're back with another huge update to give you even more visibility of your application's performance.
Today, we're excited to announce that we're bringing queue management to the Vapor dashboard!
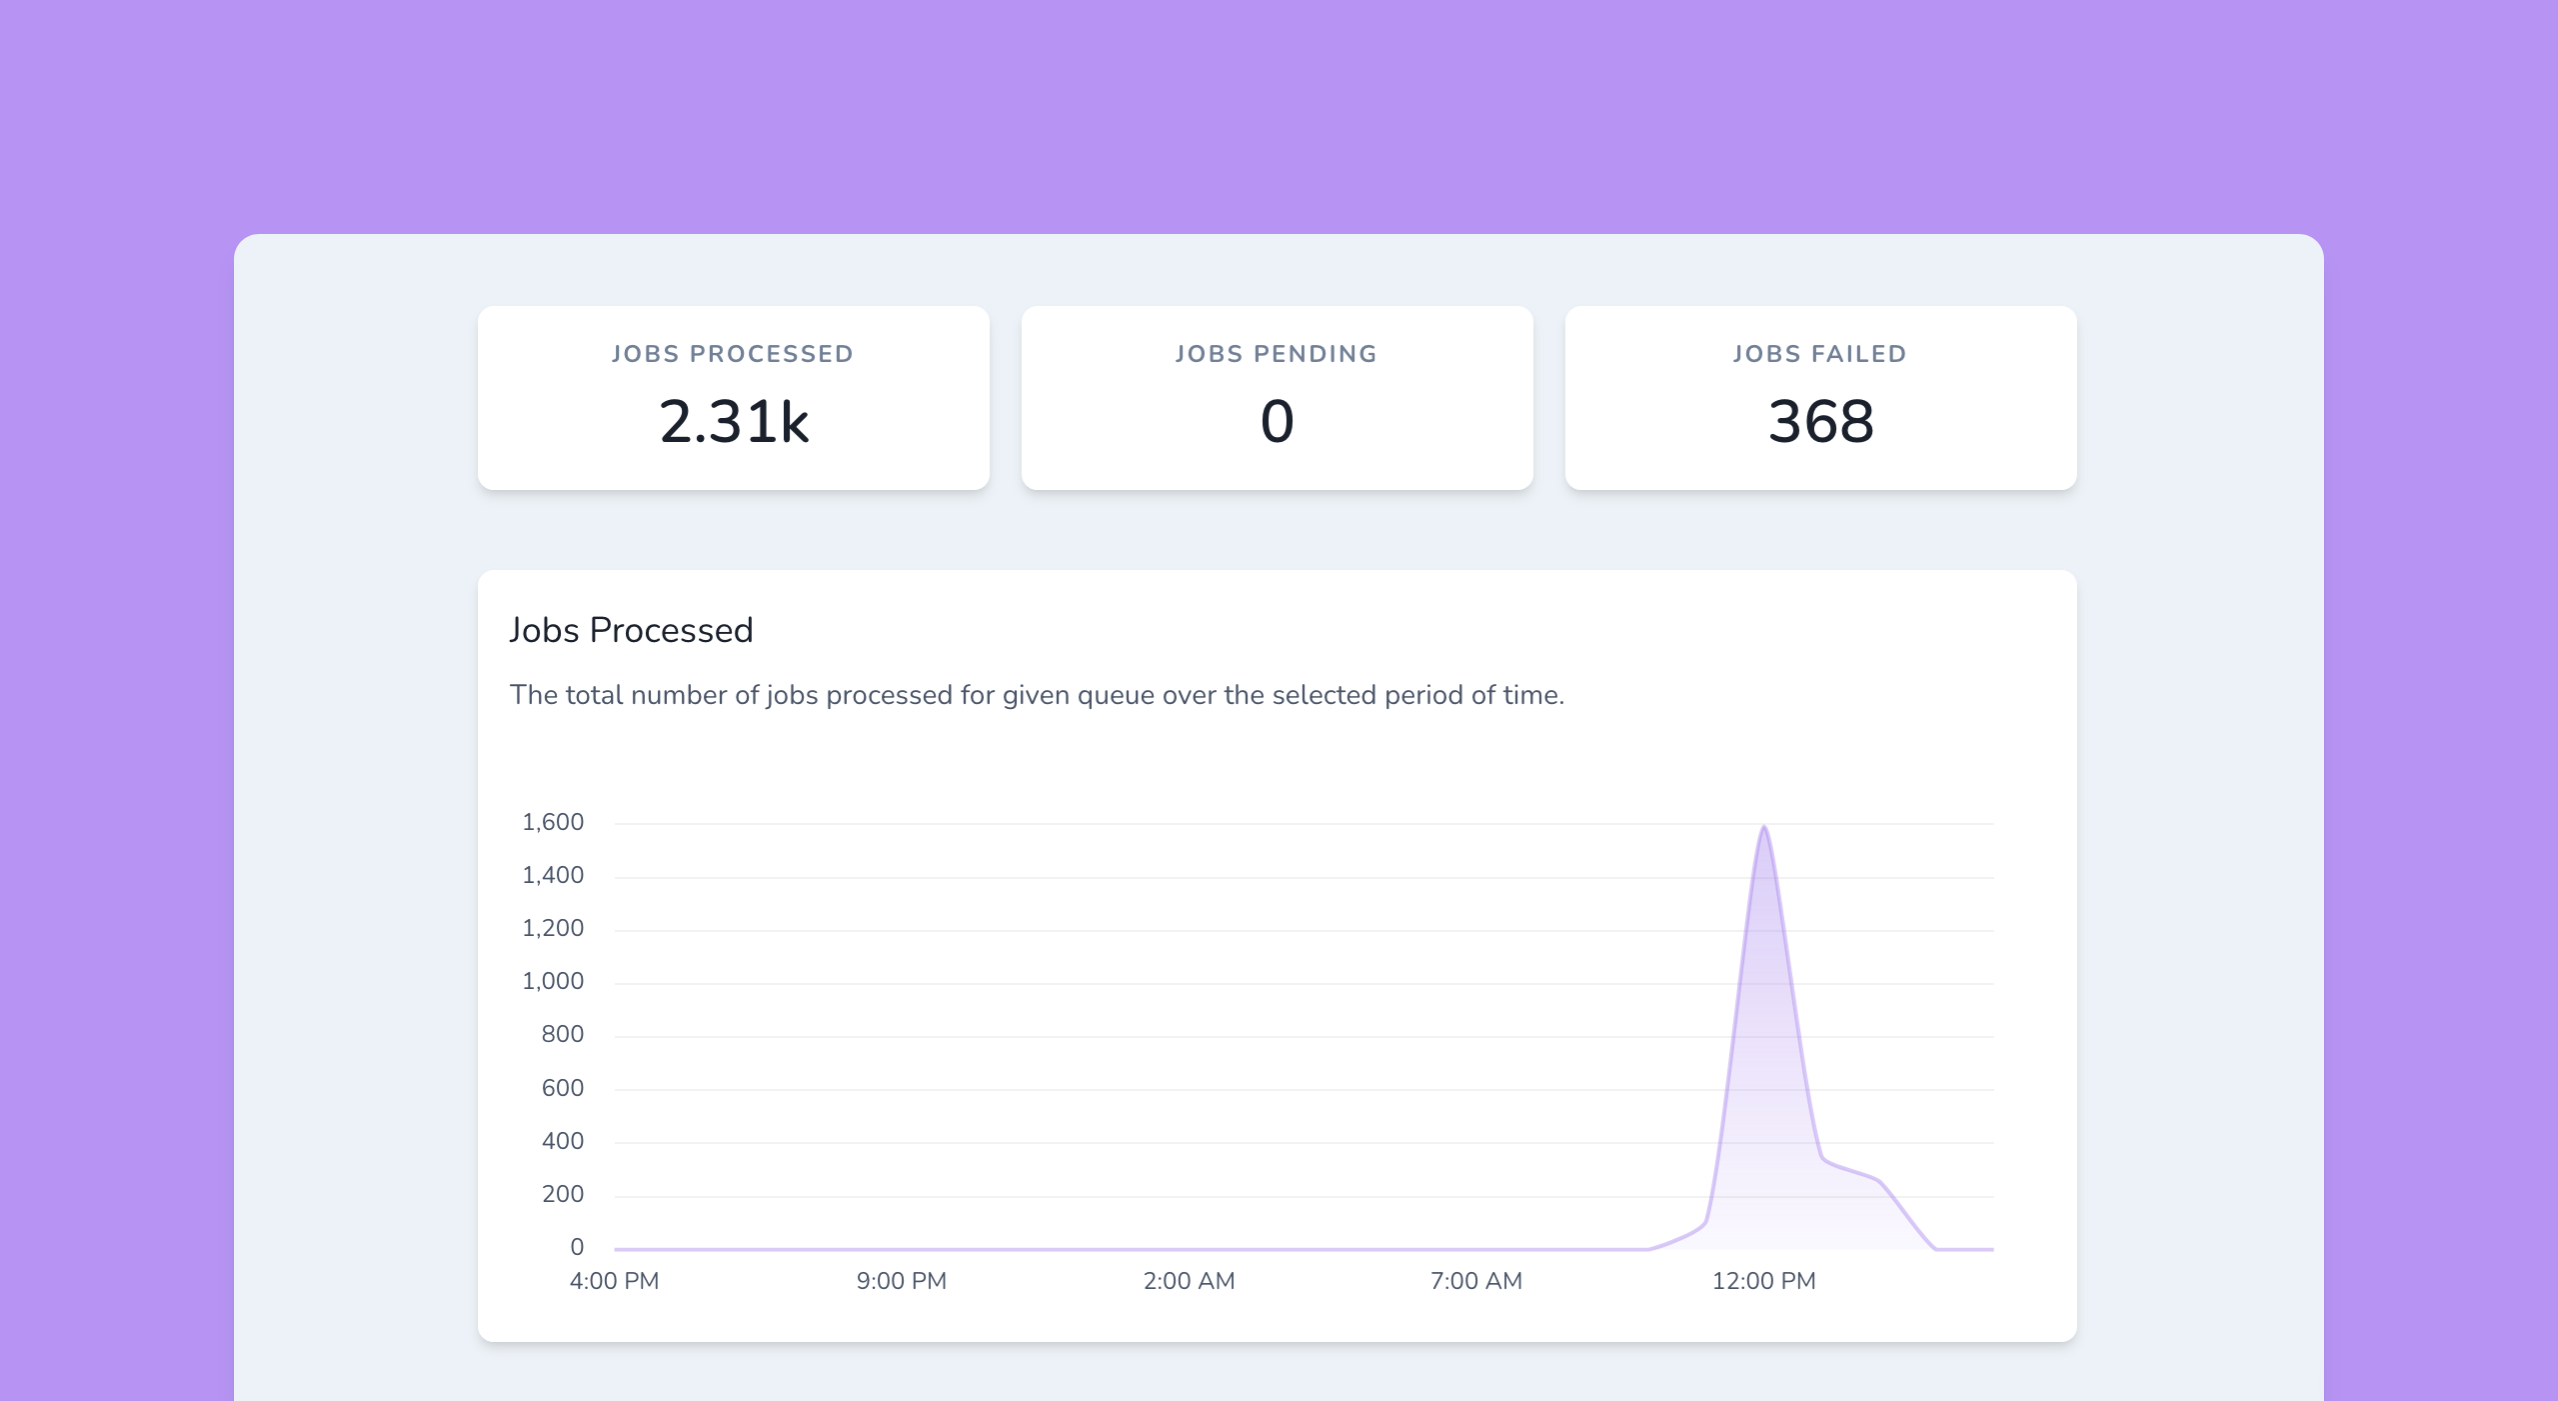
To get started, head over to any environment in your Vapor account and navigate to the "Queues" tab. Here, you see a snapshot of your queue performance including the number of jobs processed, in flight jobs, and failed jobs over time. Of course, you may refine the results by selecting a specific queue and period.
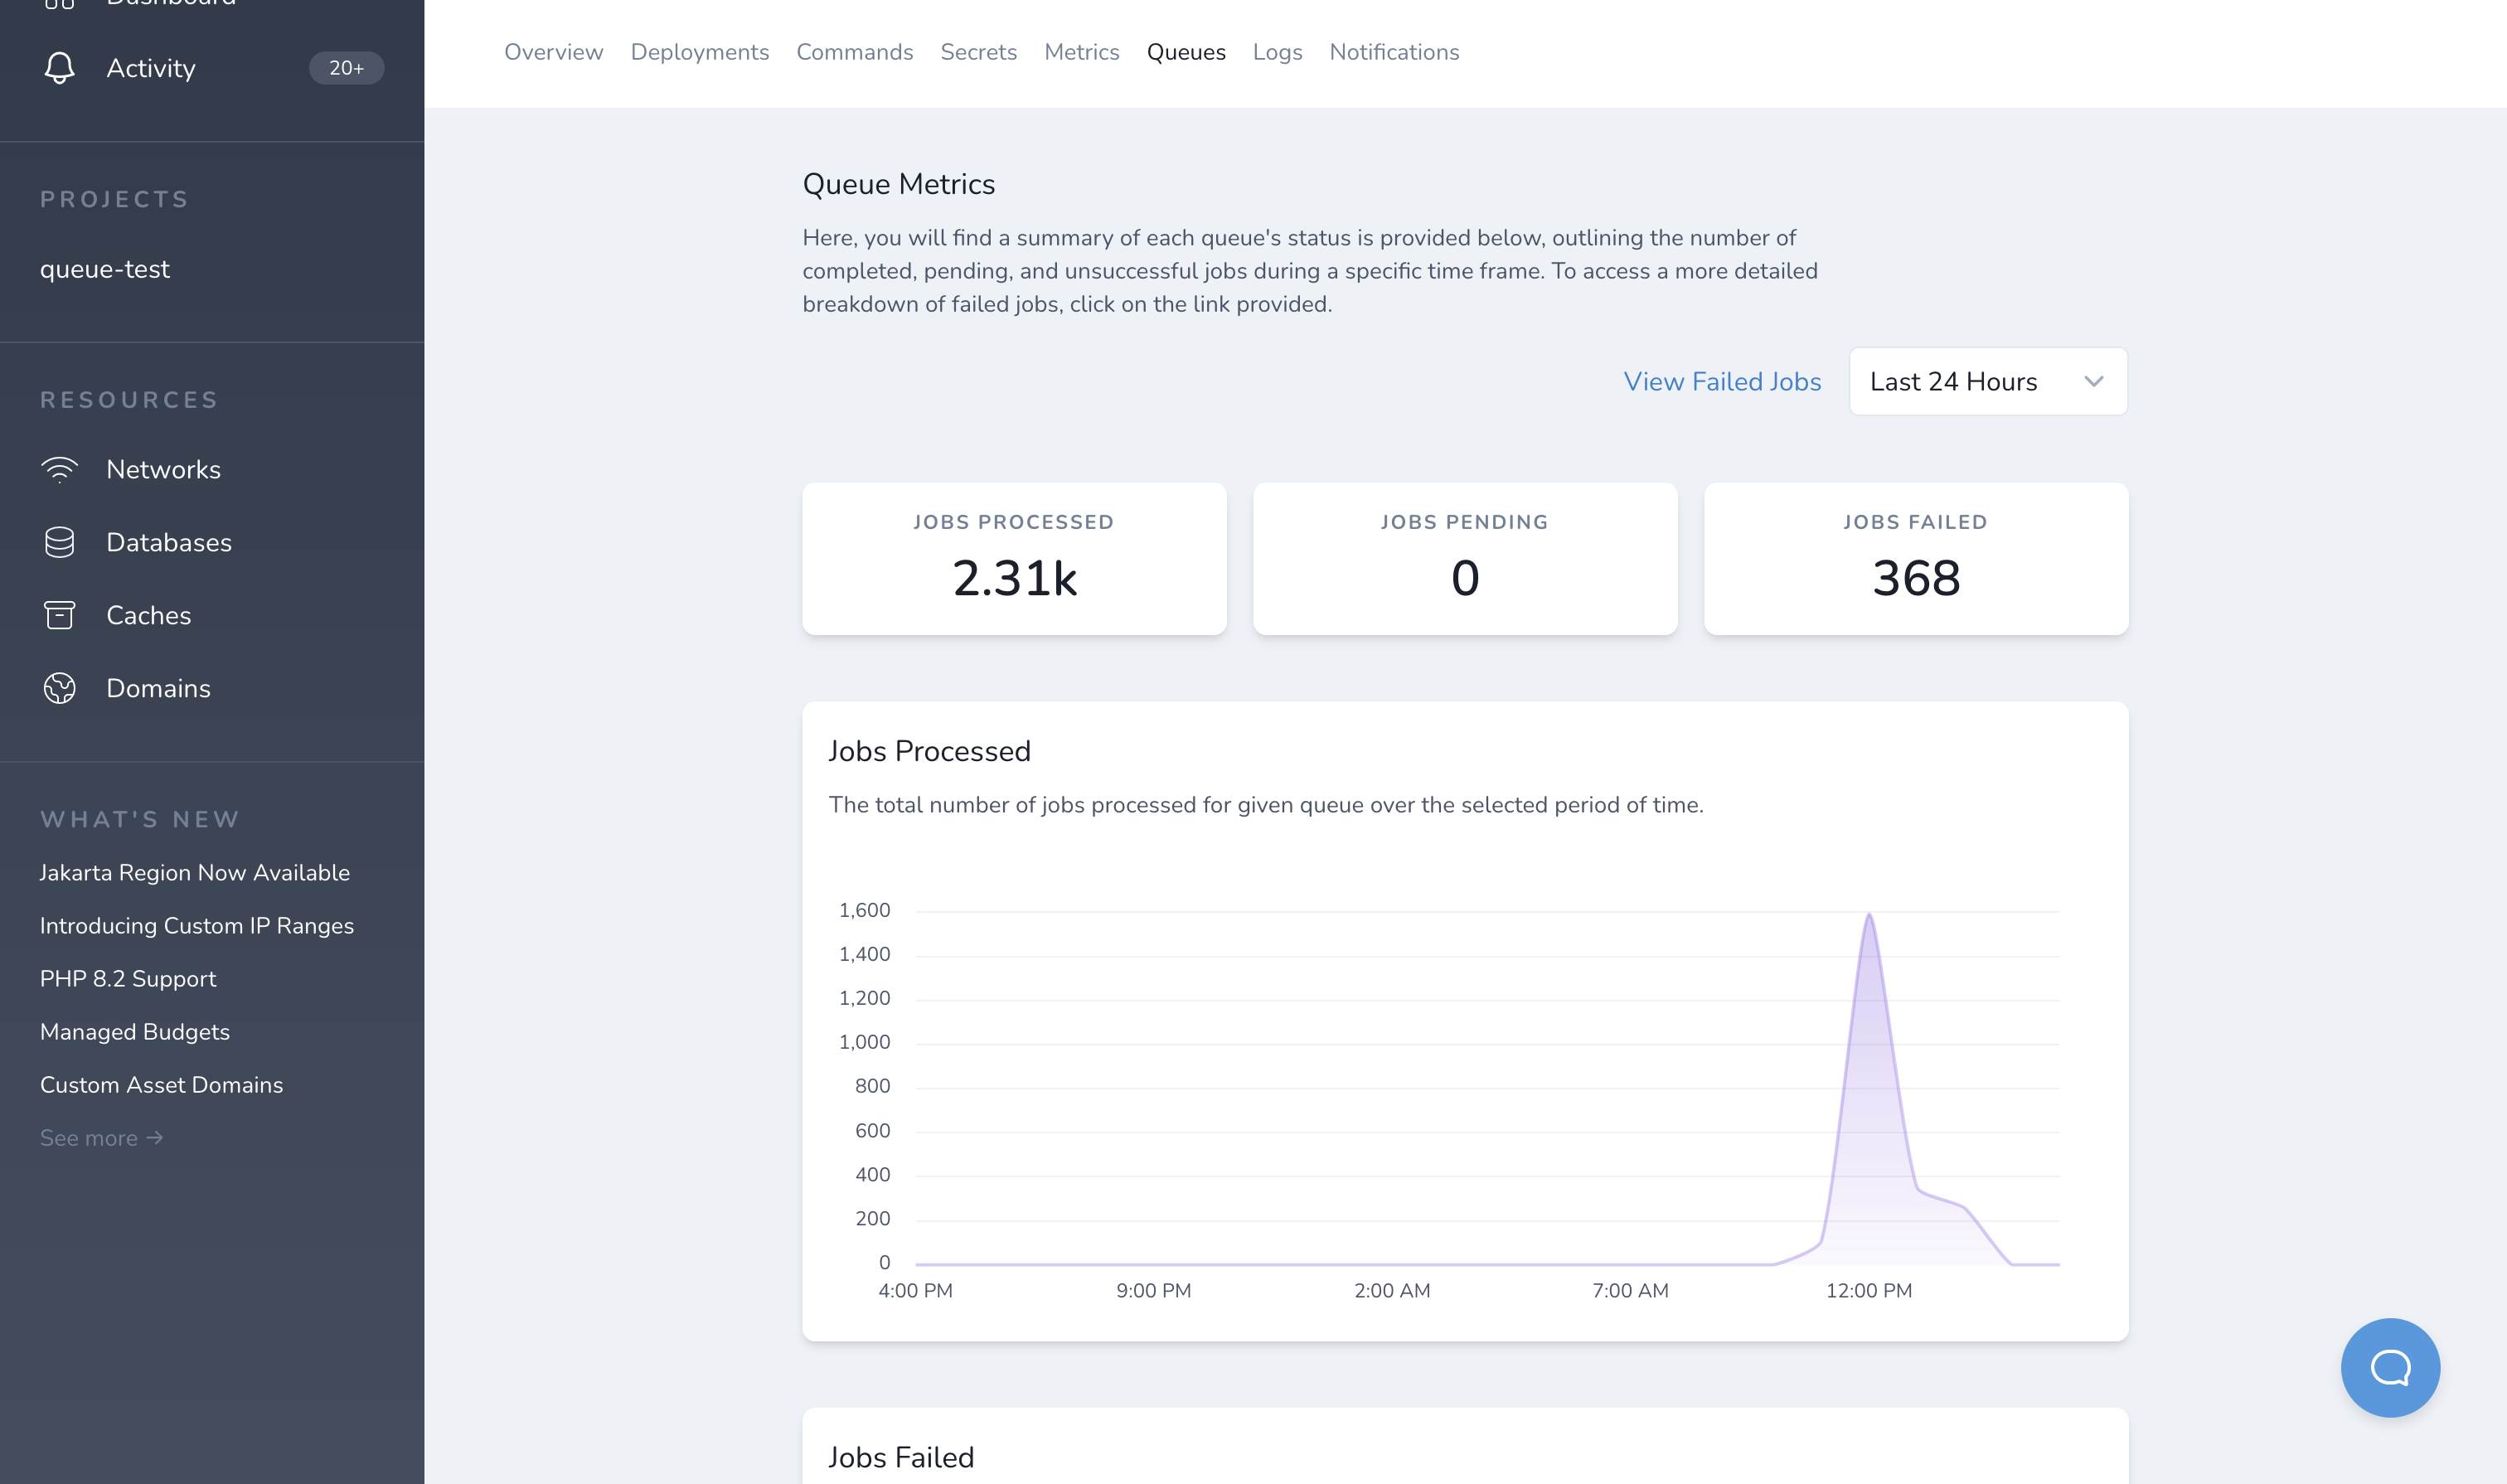
With this information at your fingertips, you can feel confident that your queues are performing as expected.
But wait, there's more!
If that wasn't enough, we've also taken the pain out of interacting with your failed jobs. If Vapor detects any failed jobs from your selected filters, you may follow the "View Failed Jobs" link, where you'll see a list of failed jobs matching those filters. You may refine the results further by choosing a different queue or period, or by providing a search term.
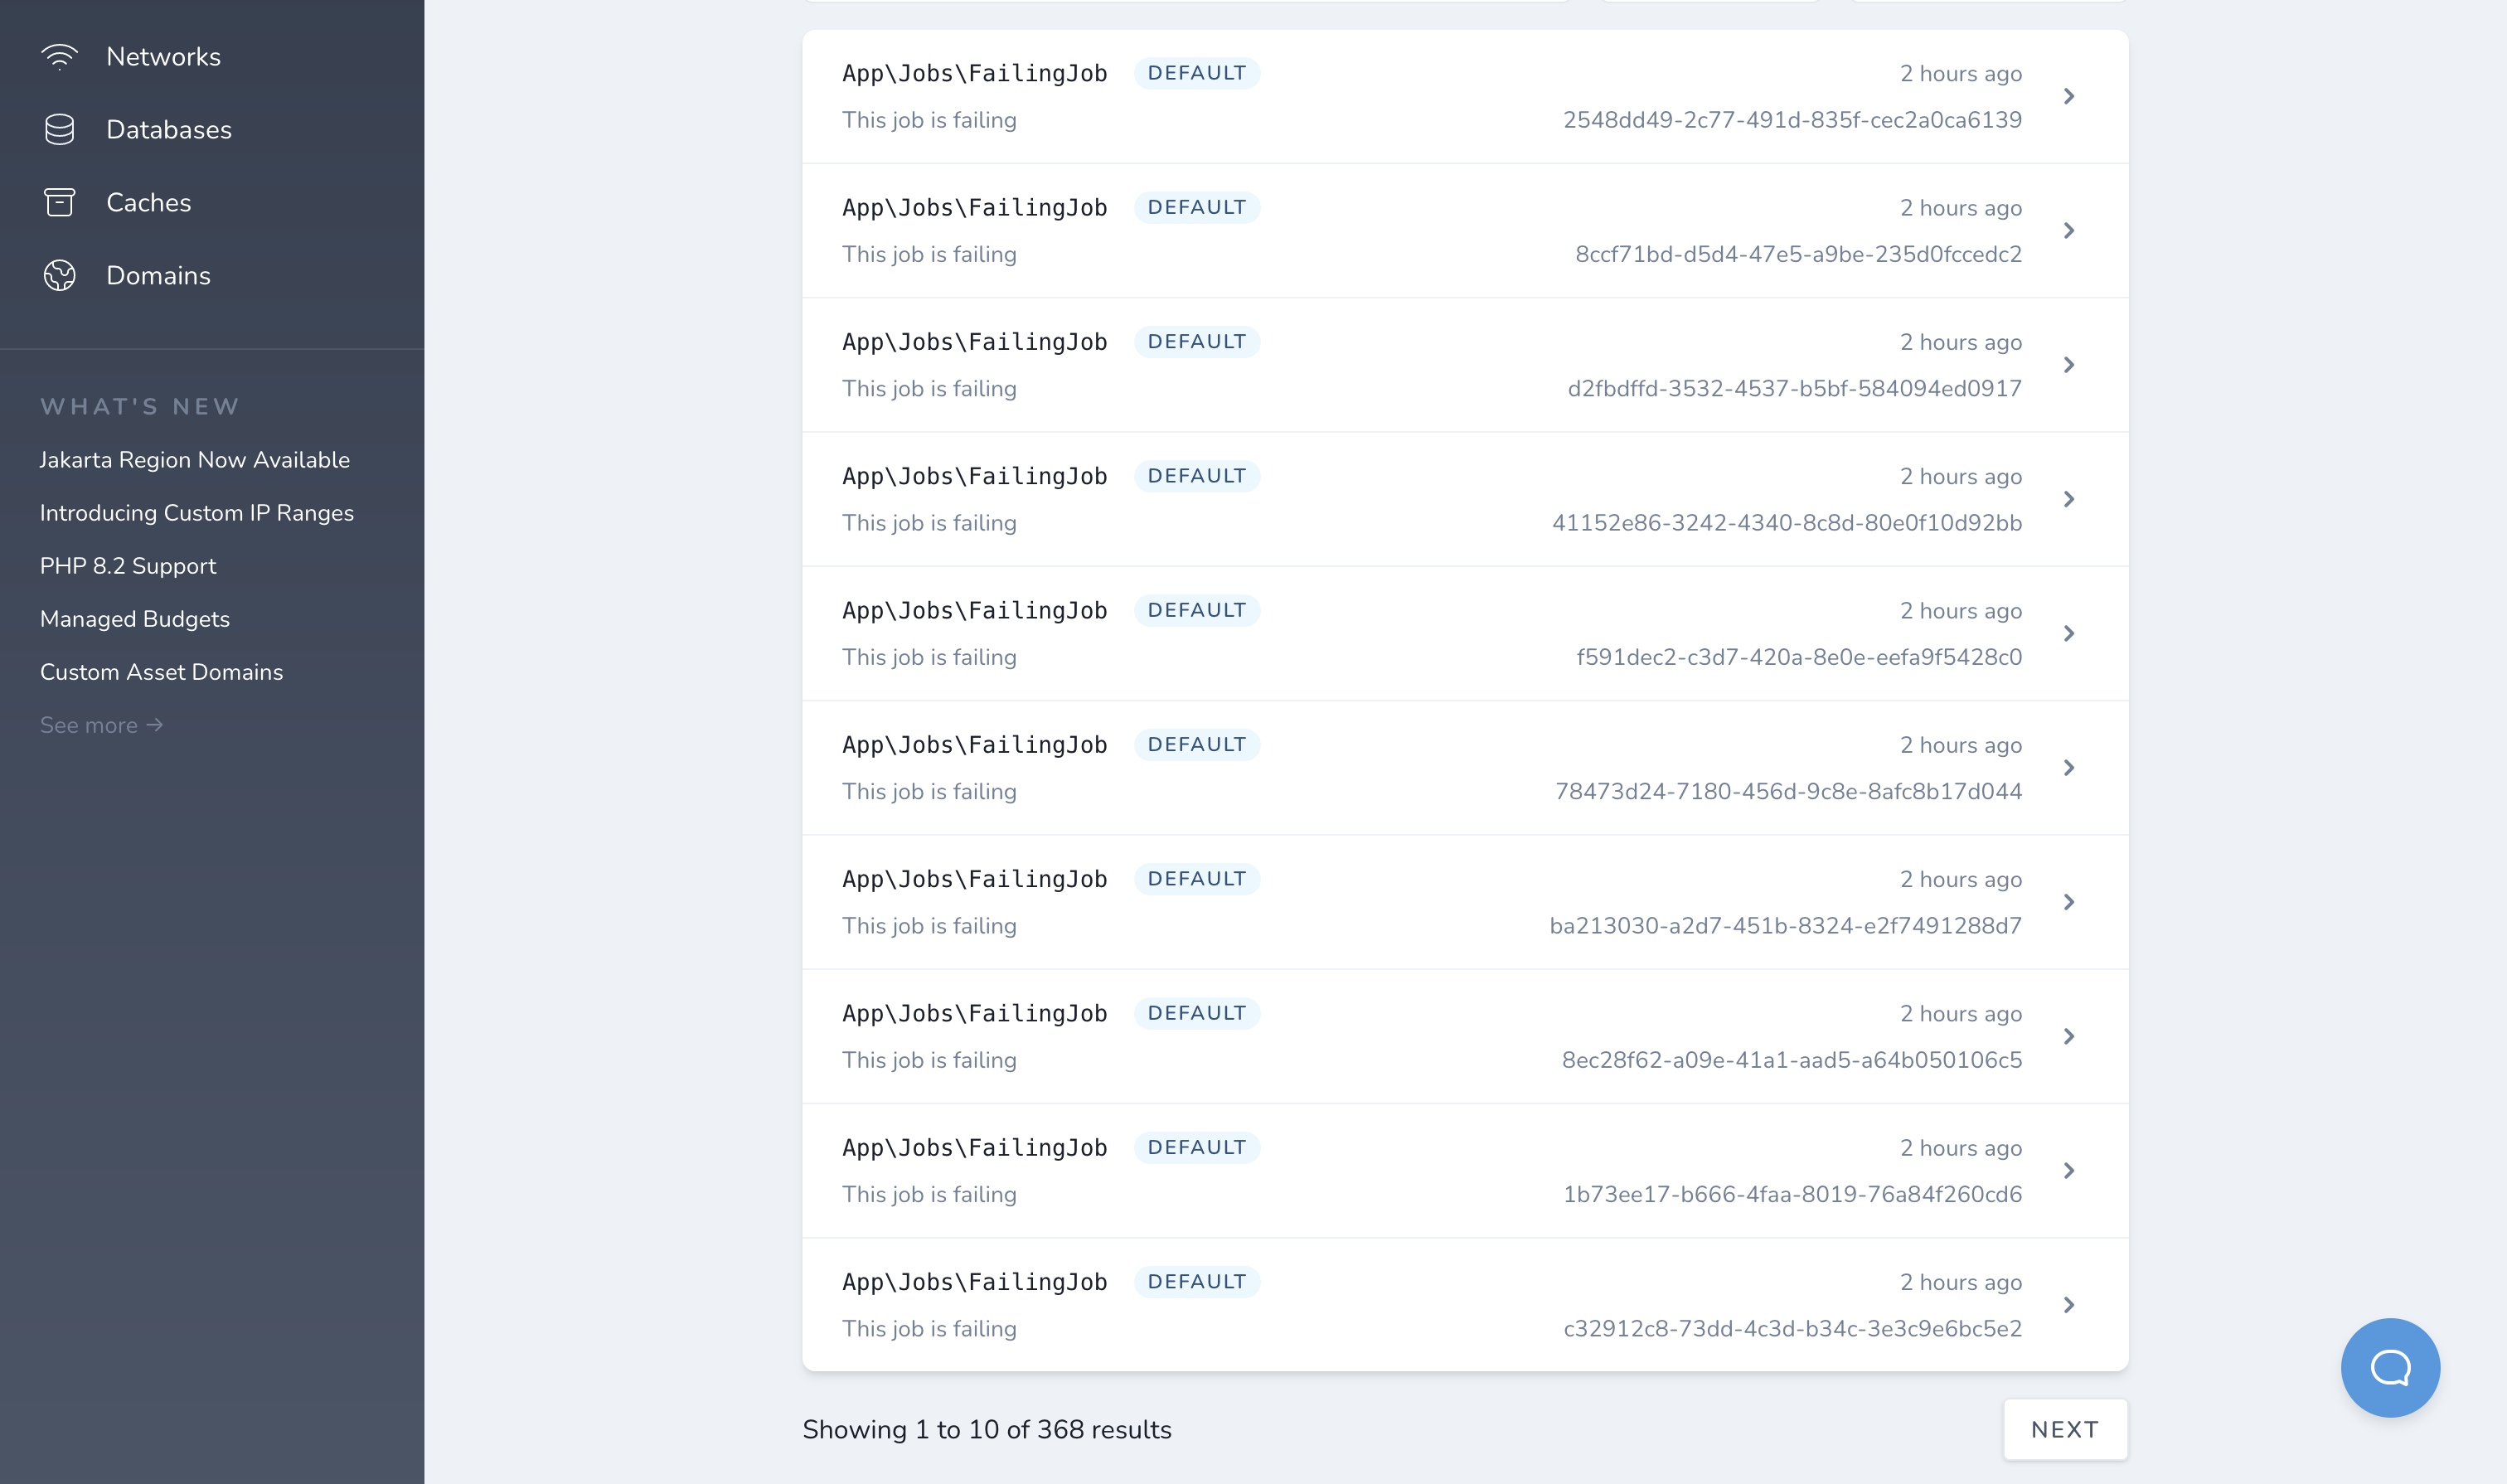
You may click on an individual failed job to access the payload and stack trace to help debug the issue.
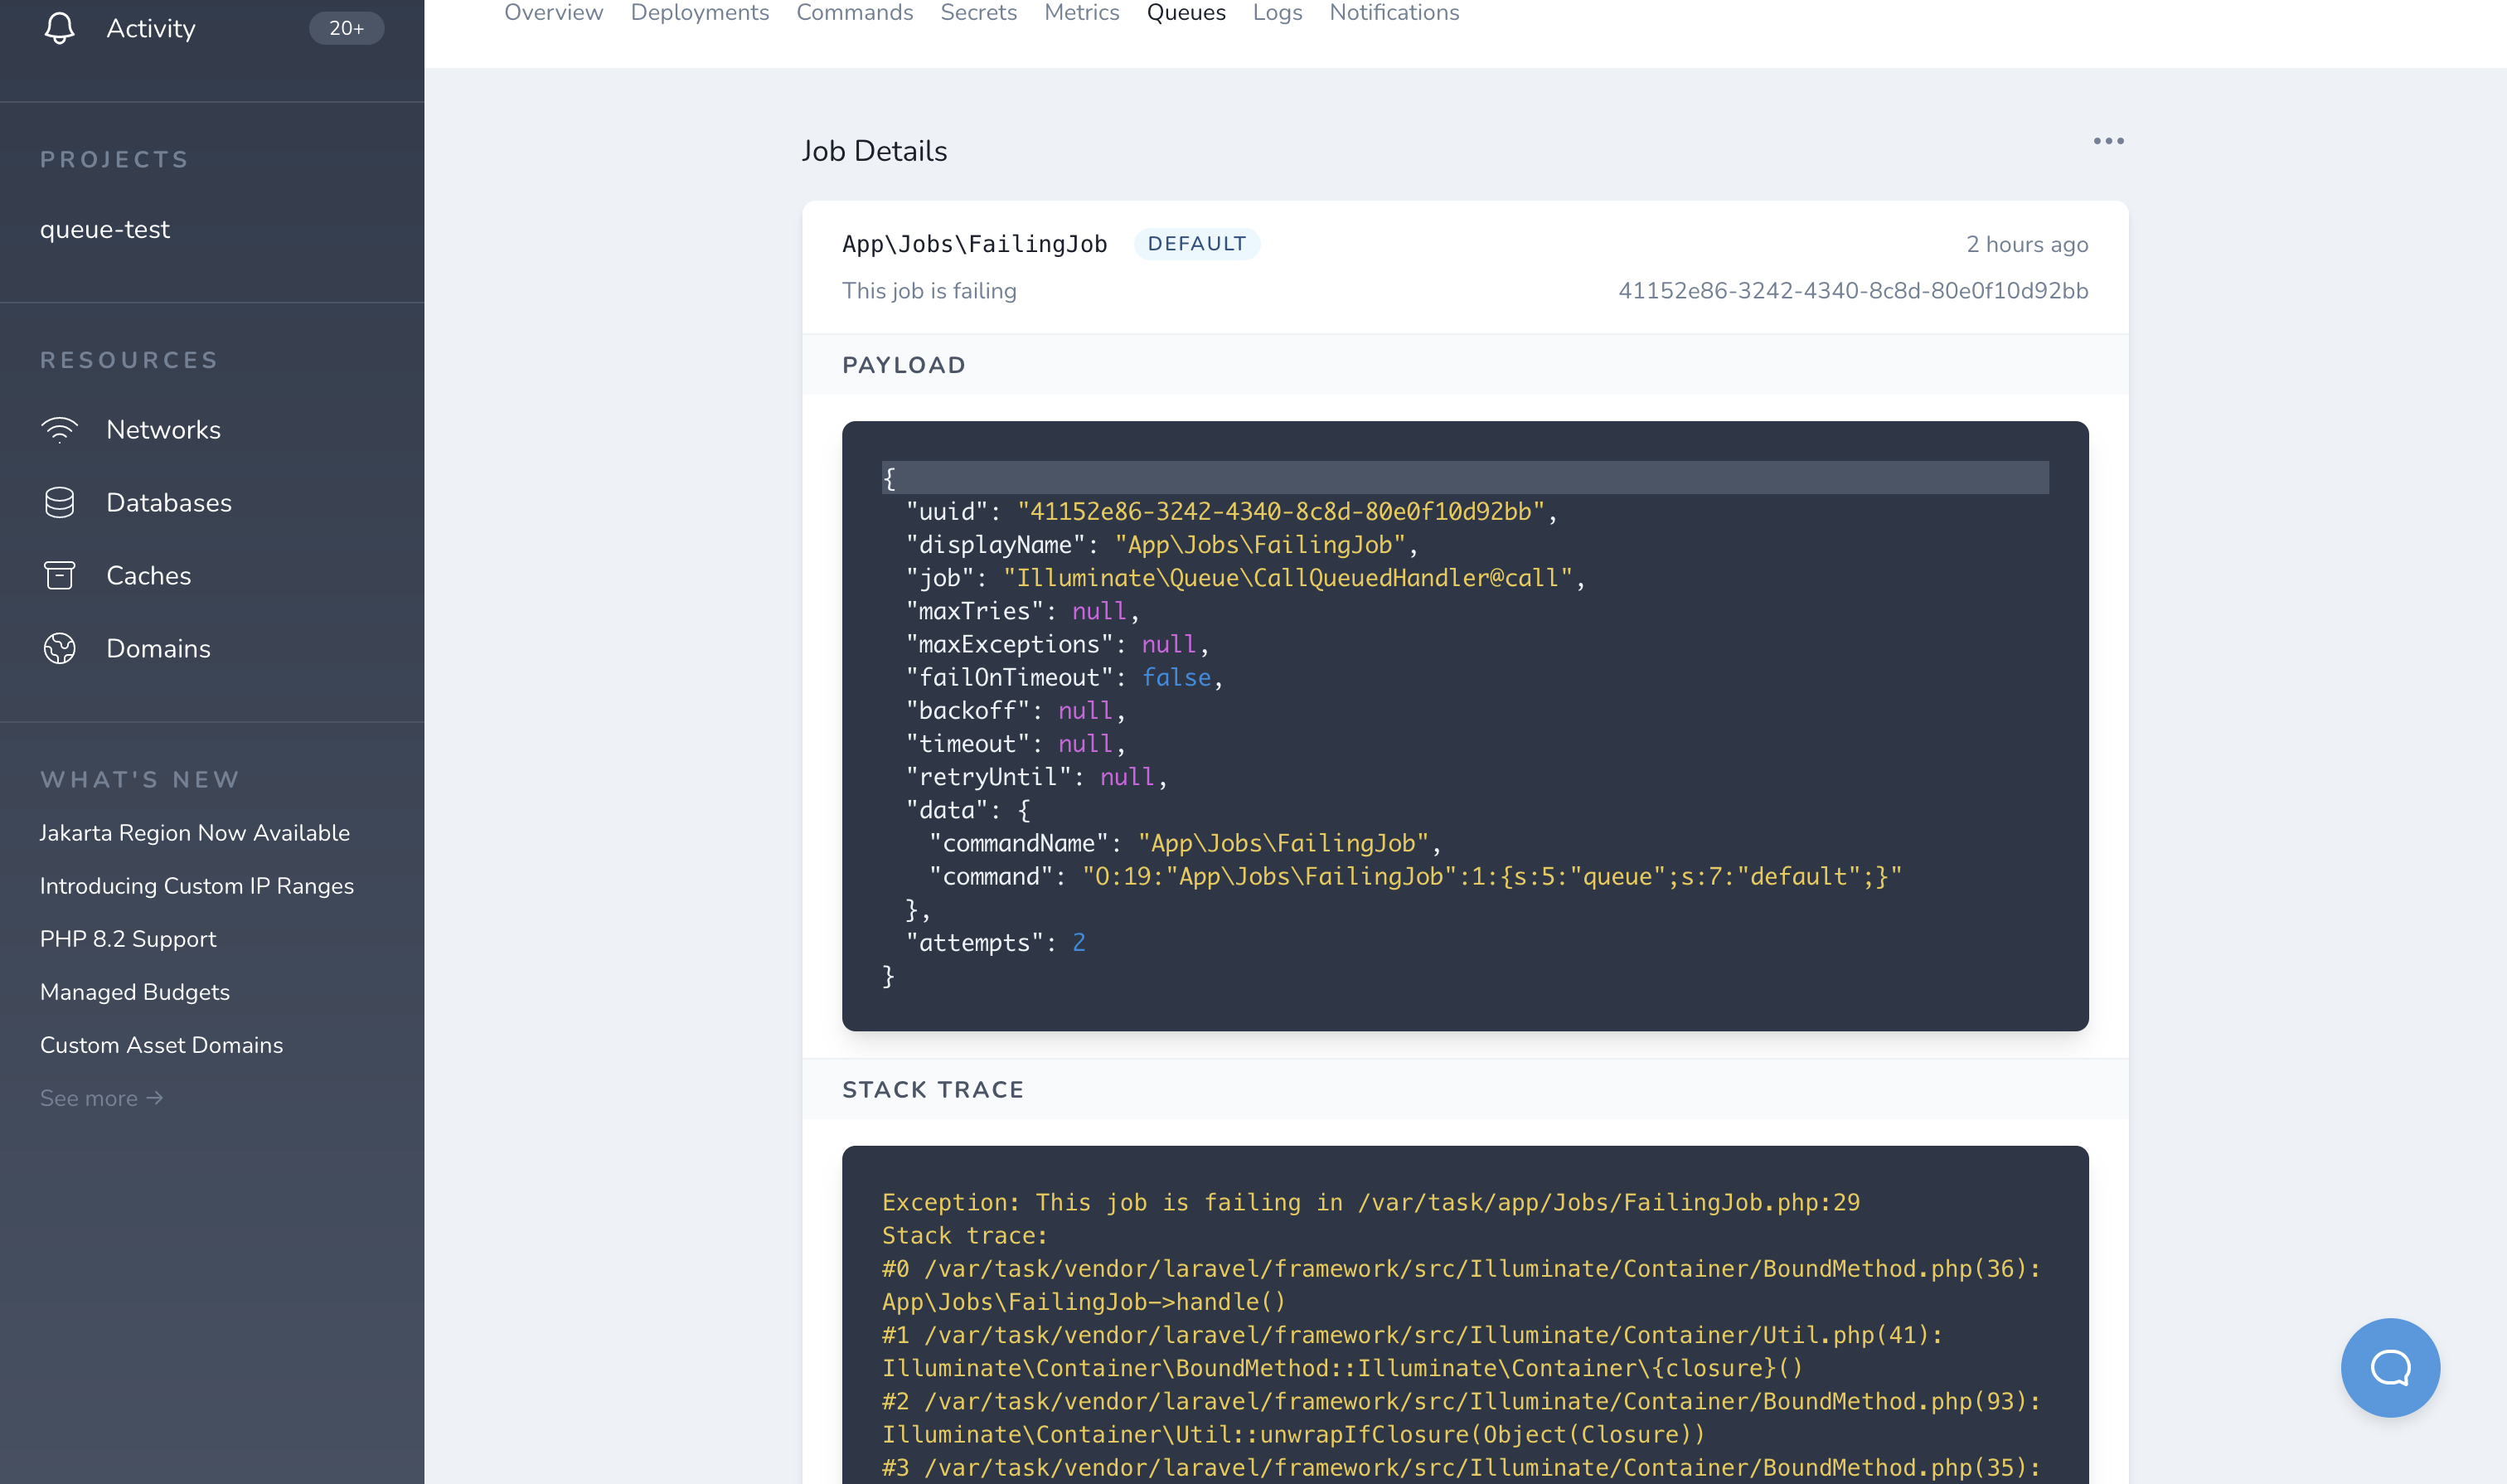
Finally, we have also made it possible to retry or delete a failed job by selecting the appropriate option from the context menu when viewing a failed job. Behind the scenes, Vapor will directly invoke the CLI function of your application, calling the queue:retry or queue:forget Artisan commands.

These awesome new features are available on Vapor beginning today. But, to access the ability to interact with failed jobs, you will need to ensure your application is running a version of Vapor Core >= 2.29.0.
We're incredibly excited to share this new update with you and provide you with an even greater insight into your application's performance. We hope you're eager to start using it today!


