

In the past, interacting with your Vapor application's logs could be cumbersome. Finding the correct log stream in CloudWatch is complex, and when you eventually do so, finding the log entry you're interested in can be a frustrating experience.
Until now!
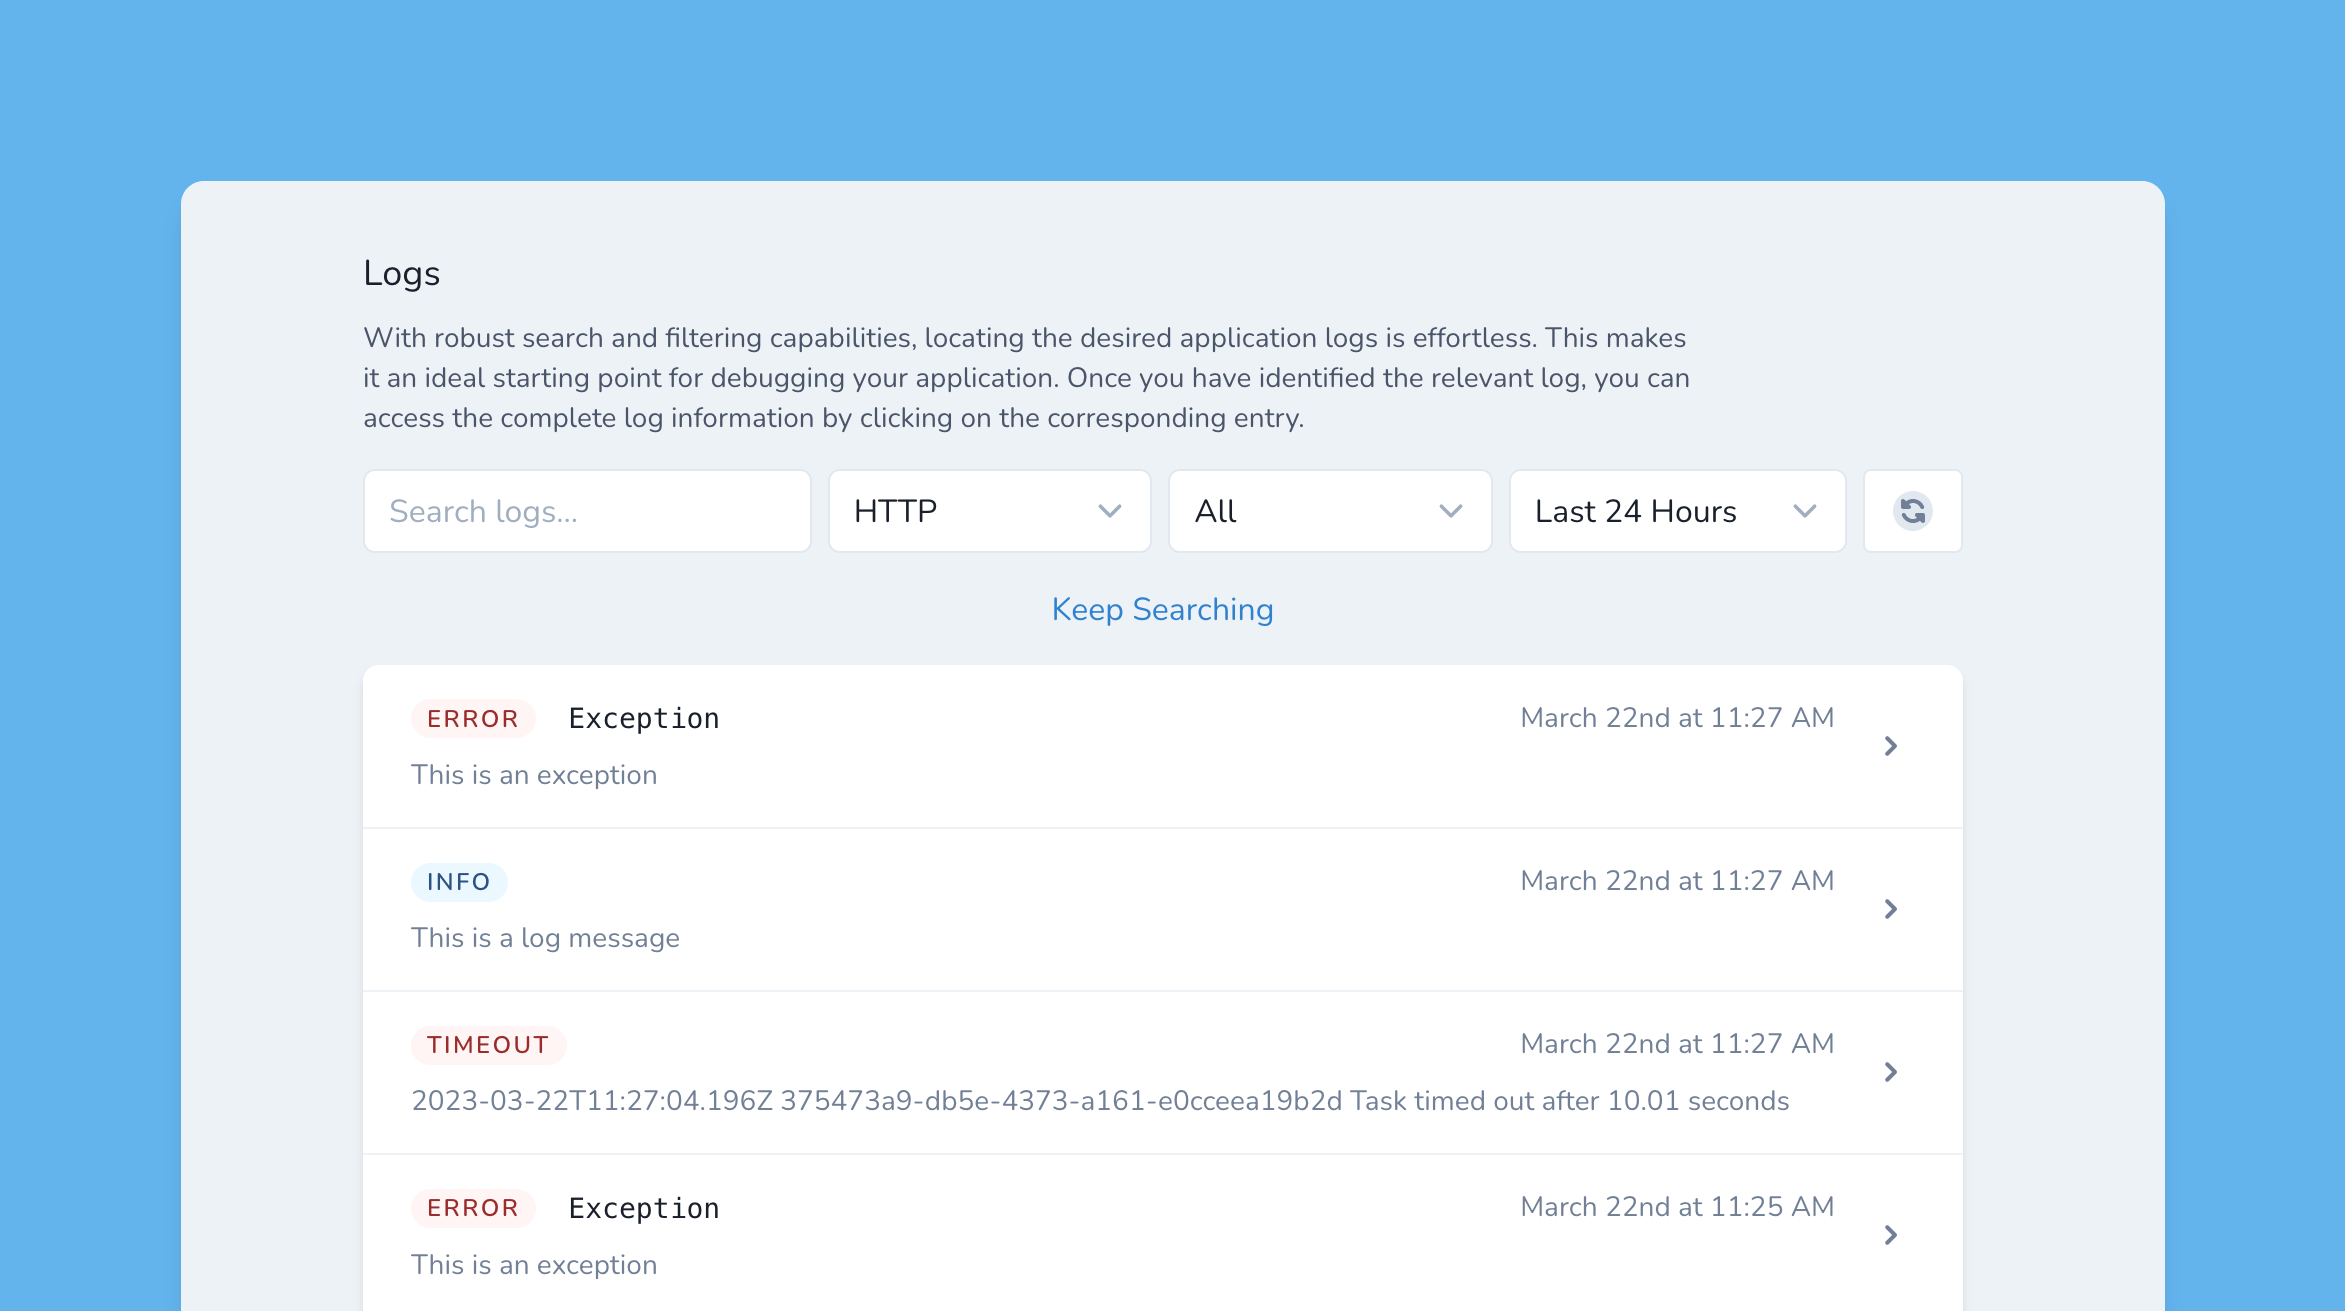
Today, we're excited to announce that by combining the power of CloudWatch with the sleek and intuitive Vapor UI, we're making application logs available directly in the Vapor dashboard.

You can try it today by navigating to one of your application's environments in the Vapor dashboard and clicking the "Logs" tab.

Here, you can easily search and filter your application's logs, making debugging a breeze. You may use the search field to find a specific exception message or search the context data of a particular log statement.
You may filter your logs by your HTTP, CLI, or queue functions or for a particular log level such as info, error, or warning. Know when an issue occurred? It's also possible to limit your results to a specific time period.
Once you have found the entry you're interested in, click it to see an expanded view of the log entry, including its exception details and context.

We're super proud of this update to the Vapor dashboard and we hope you're excited to start using it today!