

This internal test helped us prepare Nightwatch for launch and greatly improved Forge’s performance. The monitoring insights generated are directly leading to improvements and a massive update to Forge that we’ll share at Laracon. Quite frankly, it made us better Laravel developers.
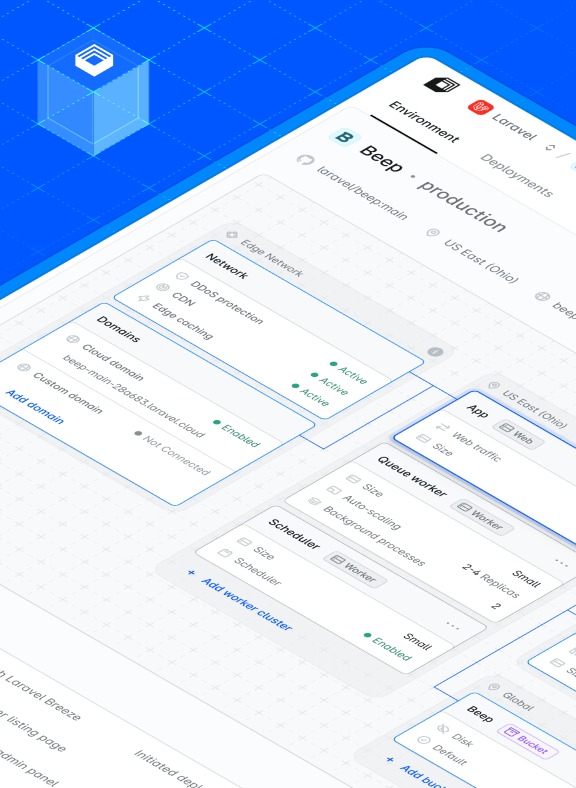
When we started building Laravel Nightwatch, our goal was clear: give deep, native monitoring to Laravel developers with less fuss and context switching than current third-party observability tools can. So once we had a stable internal version, we decided to dogfood it, drink our own champagne before announcing it to the public. And not on a side project, but on Forge, our high-traffic, production-grade server management platform used by tens of thousands of active customers.
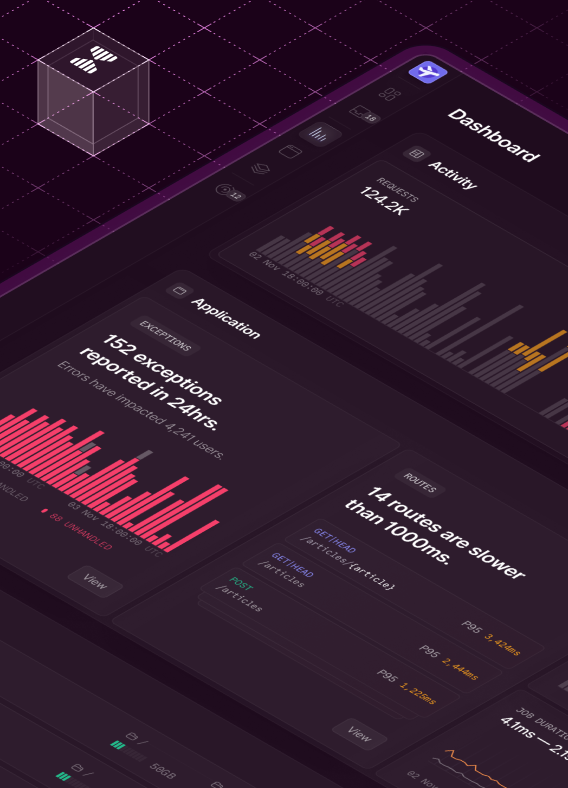
Over two months, Nightwatch silently collected 2.76 billion events across HTTP requests, database queries, background jobs, cache operations, and more. It surfaced application-level issues, provided real-time actionable insights, and honestly blew us away by causing no degradation or noise at such a massive scale.
Here’s what we learned from using Nightwatch on Forge at scale.
Laravel Monitoring: Forge Numbers
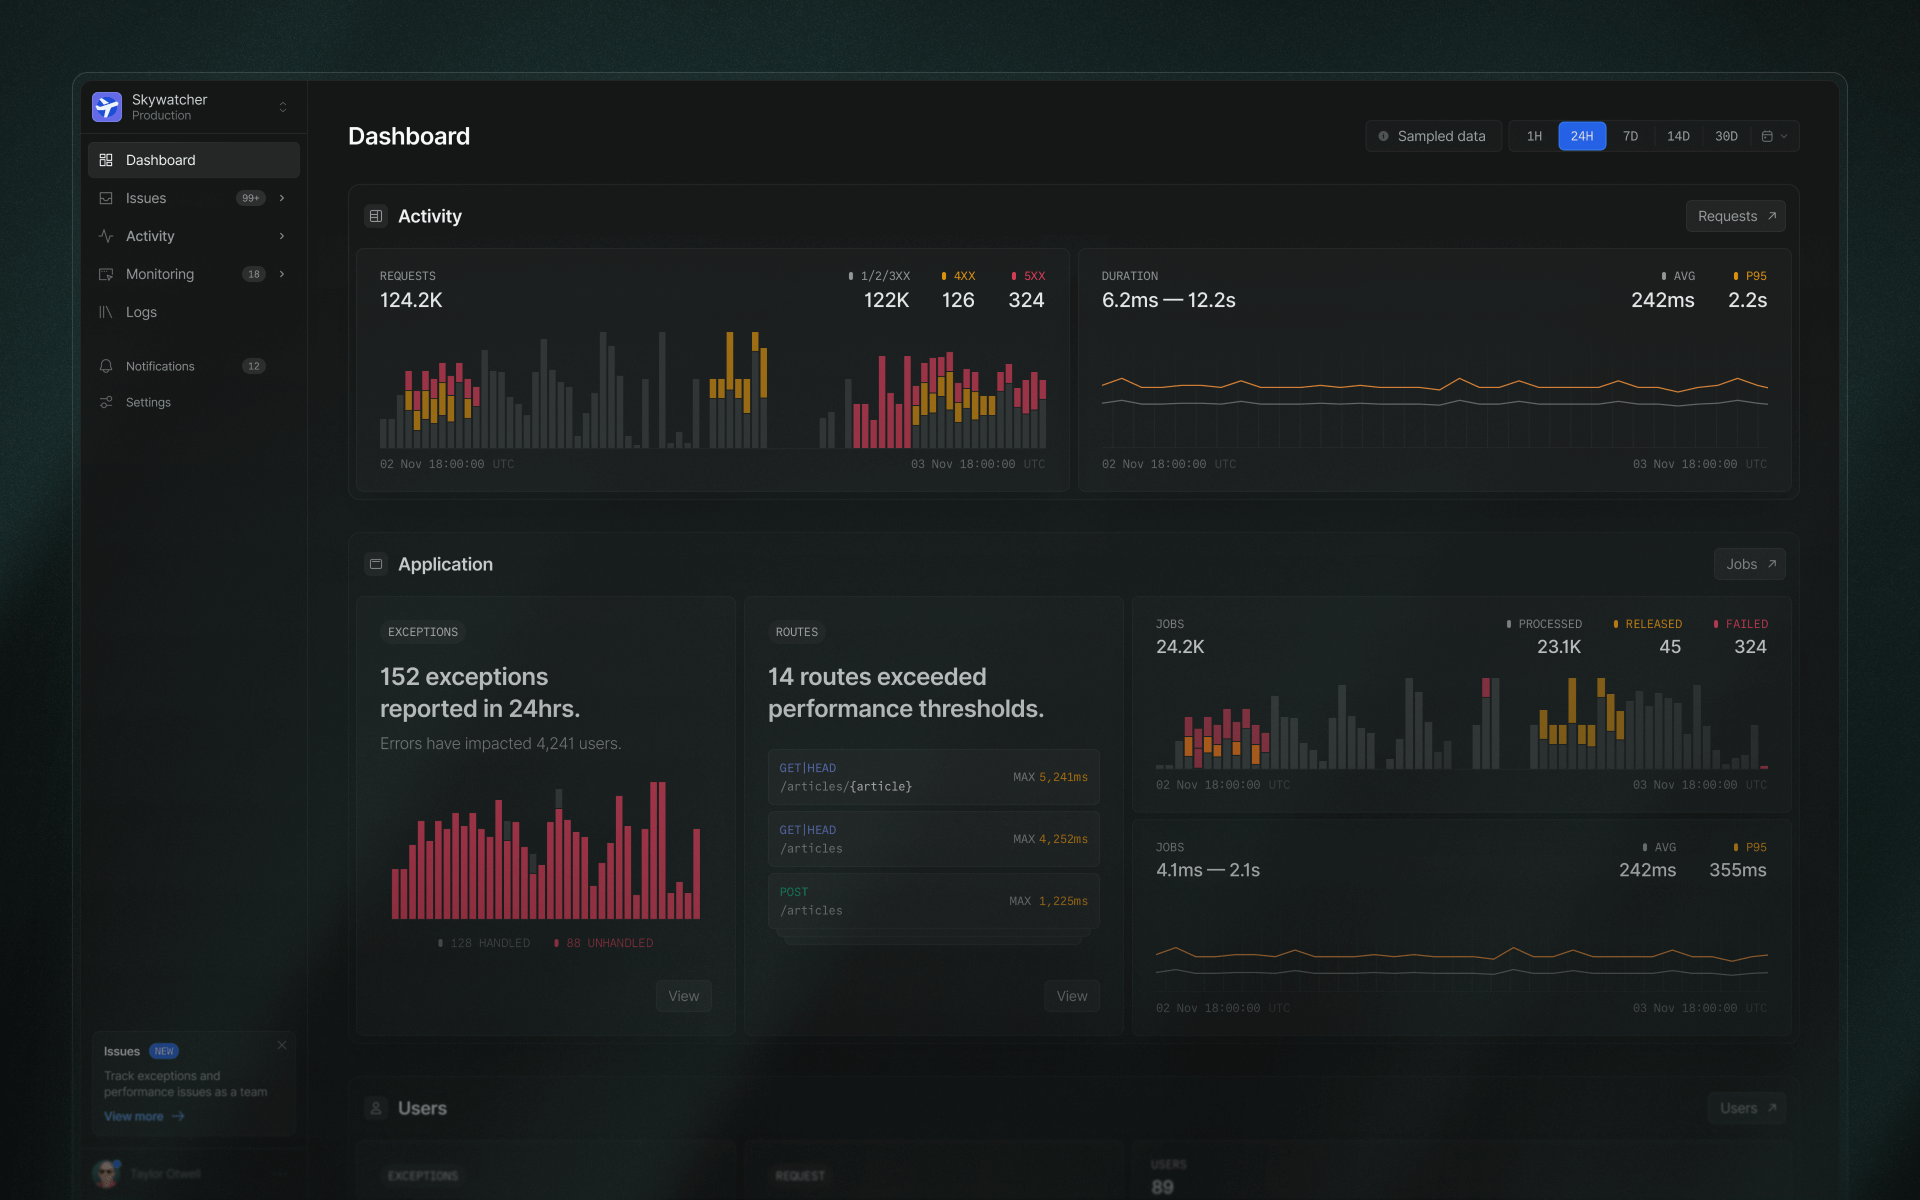 Using Nightwatch on Laravel Forge gave us deep visibility into how a high-traffic Laravel application behaves under real production load. Nightwatch focused on Forge's hidden layers, from slow queries to subtle cache issues to spikes in exceptions. Aligning with Laravel’s philosophy of developer convenience, it also did it automatically, with zero manual setup.
Nightwatch helped us tune performance, reliability, and architecture, ingesting and indexing 2.76 billion events over two months, ultimately making us better Laravel developers.
Here’s a breakdown of the numbers:
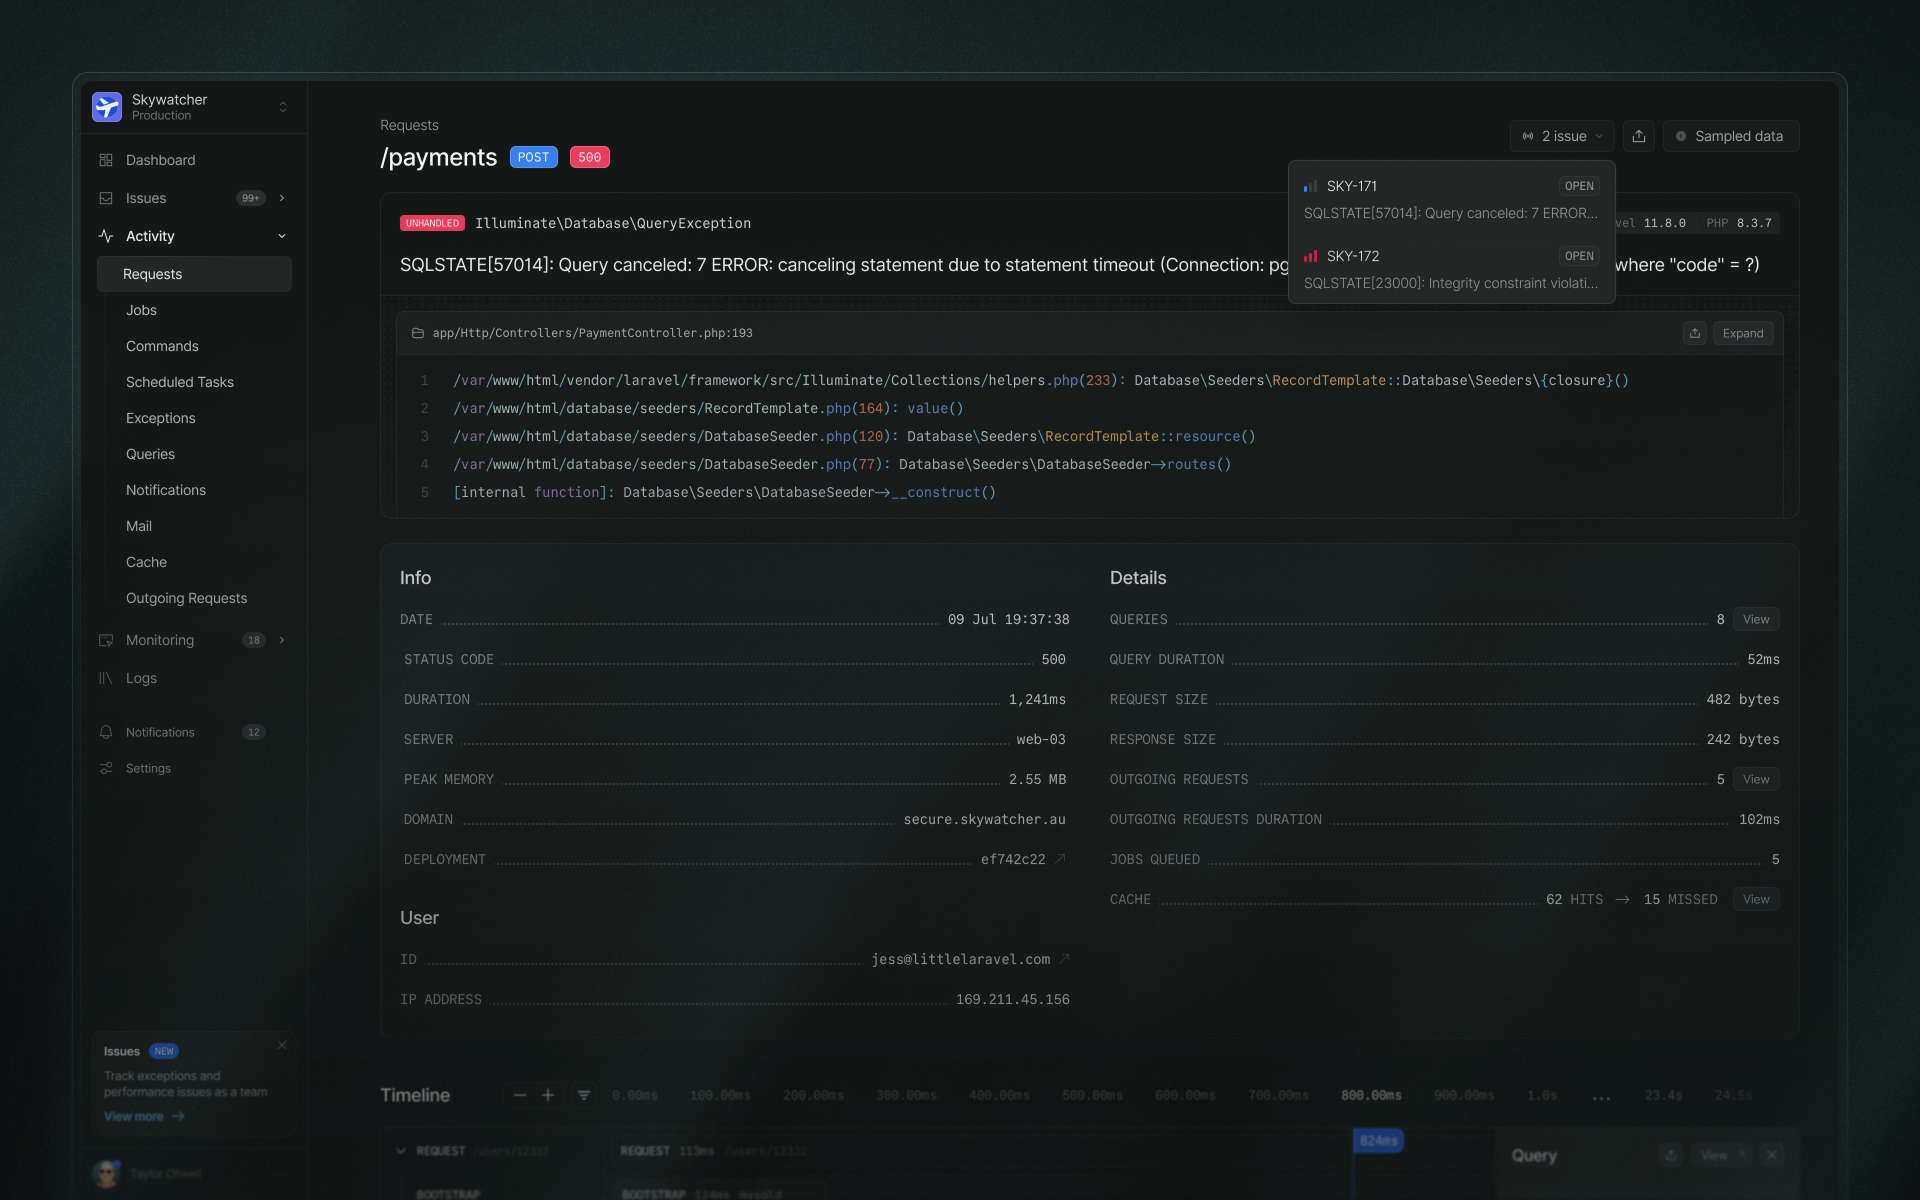
- 119 million HTTP requests, nearly four million per day, which Nightwatch tracked with full visibility into latency and errors.
- 1.5 billion database queries, averaging 50 million per day. Nightwatch helped us spot locking, N+1 patterns, and slow queries quickly.
- 245 million cache events monitored by Nightwatch, revealing a 90% hit rate for Forge. This is a strong indicator of healthy cache usage. However, Nightwatch also surfaced misses and other points of inefficient usage.
- 256,000 emails sent and tracked as first-class events in Laravel’s notification lifecycle.
- 2.4 million outgoing requests, including 647,000 to GitHub. Nightwatch made third-party latency and failures traceable.
- 78,000 exceptions with full context attached, turning error handling into proactive debugging.
- 7.7 million queued jobs, of which Forge processed 7.6 million successfully. Nightwatch helped us catch retry loops, failure spikes, and optimize queue throughput.
These numbers were as interesting as they were revealing. With Nightwatch capturing such a broad spectrum of activity, we began to see patterns and anomalies we wouldn’t have caught otherwise. That included real performance wins, but also real threats.
Nightwatch Key Discoveries: Security Concerns
Nightwatch helped us catch real abuse, fast.
One of the first things it surfaced was a spike of 324,000 login attempts over a short period. Not normal. These were brute-force login attempts or credential stuffing attacks targeting Forge’s authentication system. Without Nightwatch’s centralized visibility, this spike might have gone unnoticed until much later. The ability to quickly spot this anomaly helped us investigate and act before it caused real harm.
With Nightwatch tracking request paths in real time, we could immediately detect the pattern, pinpoint the time of the attack, and roll out rate limiting on the login endpoint. It turned raw traffic data into actionable intelligence that we could use to stop a threat.
“This is the kind of stuff you usually find out about when your app is already on fire. Nightwatch gave us a heads-up.” — Jess Archer
But it didn’t stop there. Nightwatch also revealed that our webhook endpoint was being hammered with 48 million requests using invalid tokens. While this wasn’t a direct exploit, it created unnecessary load. We addressed it using Cloudflare rules to block abusive IPs or patterns upstream, plus Laravel’s built-in rate limiting to filter traffic at the application level.
Nightwatch data helped guide both actions, showing which endpoints were affected, where the traffic came from, and how often. This layered approach reduced noise, improved performance, and tightened security without disrupting Forge’s legitimate users.
Performance Bottlenecks: Found and Fixed
Every developer who has worked with a monitoring tool before knows that highlighting the issue only gets you so far. To fix it, you need to understand why it happened. Nightwatch helped us unearth many of these insights on the performance side.
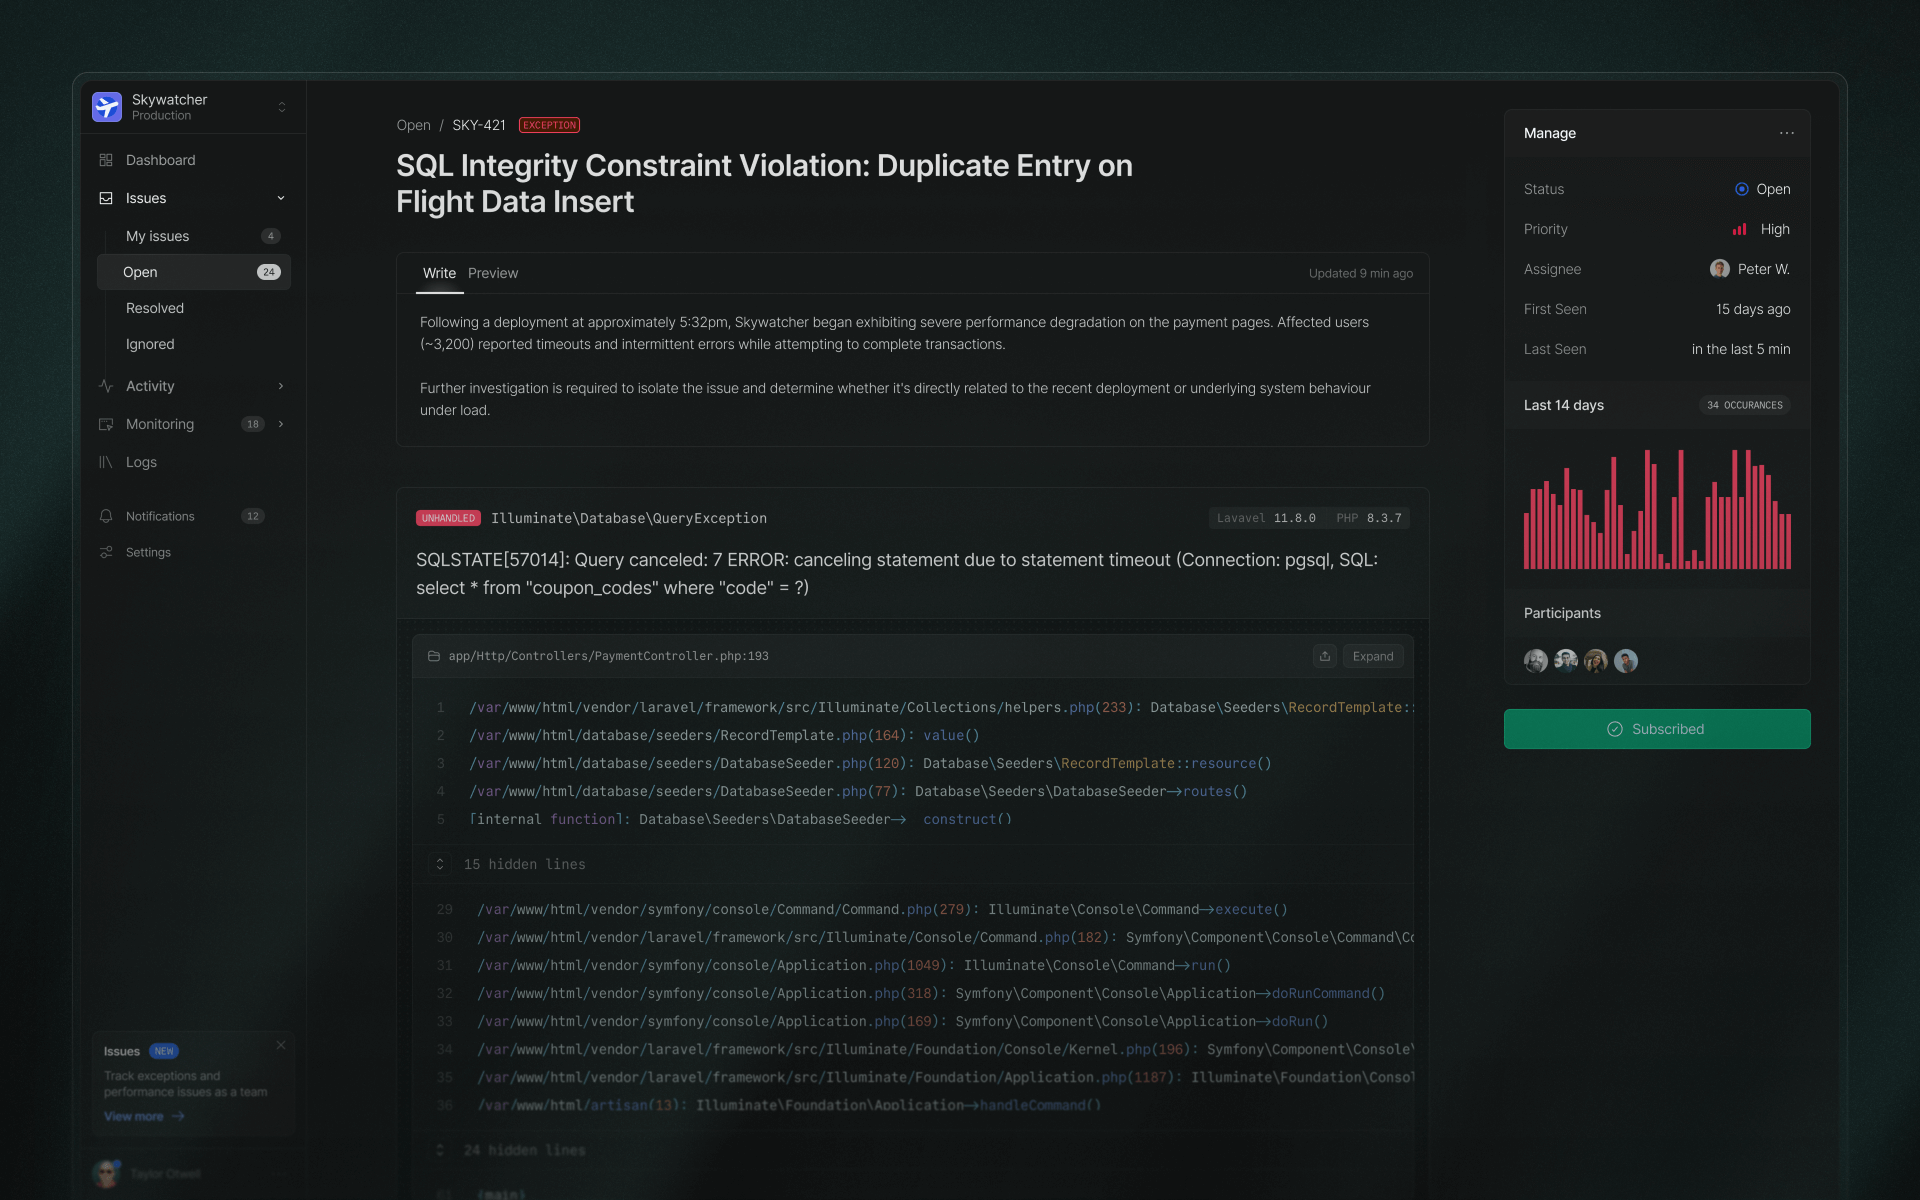 ### Recurring Issue with Database Locking
We discovered some database locking issues that were holding up user requests. These would’ve been hard to spot with logs alone, but Nightwatch’s query timing data pointed us directly to the problematic transactions. We fixed it quickly by restructuring how certain queries were run.
Slow Routes
It also exposed our slowest routes, with precise metrics:
- Nova API search: 8.84s avg (full-text search across large datasets)
- Server log retrieval: 4.84s avg (reading massive logs from remote machines)
- Server creation endpoint: 4.78s avg (long-running setup tasks by nature)
Knowing this helped us balance user expectations with potential optimizations. Some routes will always take time, but now we can explain and improve them with data.
Cache effectiveness
Nightwatch’s cache tracking showed Forge had over 245 million cache events in one month with a 90% hit rate, which is rather impressive. But it also let us dig into what’s missing the cache and optimize further.
Expensive Queries
Using Nightwatch’s query analysis, we identified inefficient queries running frequently that were contributing to overall system slowdowns. The analysis also showed us how often they ran and how much total time they took up. This drill-down revealed that some queries, even if not individually slow, had a cumulative impact on system performance, helping us prioritize and optimize or cache the worst offenders. This shows the power of aggregated query insight over isolated samples.
“The real power wasn’t spotting slow queries, but spotting frequent queries that were flying under the radar.” — Taylor Otwell
Jobs and Background Processing Insights
Beyond request performance and database load, Nightwatch gave us valuable visibility into background activity. Over two months, Forge processed 7.7 million queued jobs, with 7.6 million completing successfully. Top jobs included:
- Scheduled backups
- Server provisioning
- Artisan commands and automation tasks
With Nightwatch observing every job lifecycle, we gained real insight into failure patterns, retry behavior, and queue performance under load. It helped us spot jobs with high retry counts, diagnose edge-case failures, and optimize queue configurations accordingly. Instead of sifting through logs or guessing, we could immediately trace what happened, when it happened, and why.
Critical Incidents Caught in Real Time
That same real-time visibility proved indispensable during incidents. Nightwatch helped us detect and resolve two high-impact issues:
- Cache deserialization errors after a package update caused widespread failures. Nightwatch flagged it immediately via exception telemetry.
- Database locking caused by a deferred query pattern slowed down request handling. Nightwatch showed exactly where and when the locks were happening.
Both issues were resolved within the hour, not because we were lucky, but because we had real-time, contextual insights.
Route Popularity and Usage Patterns
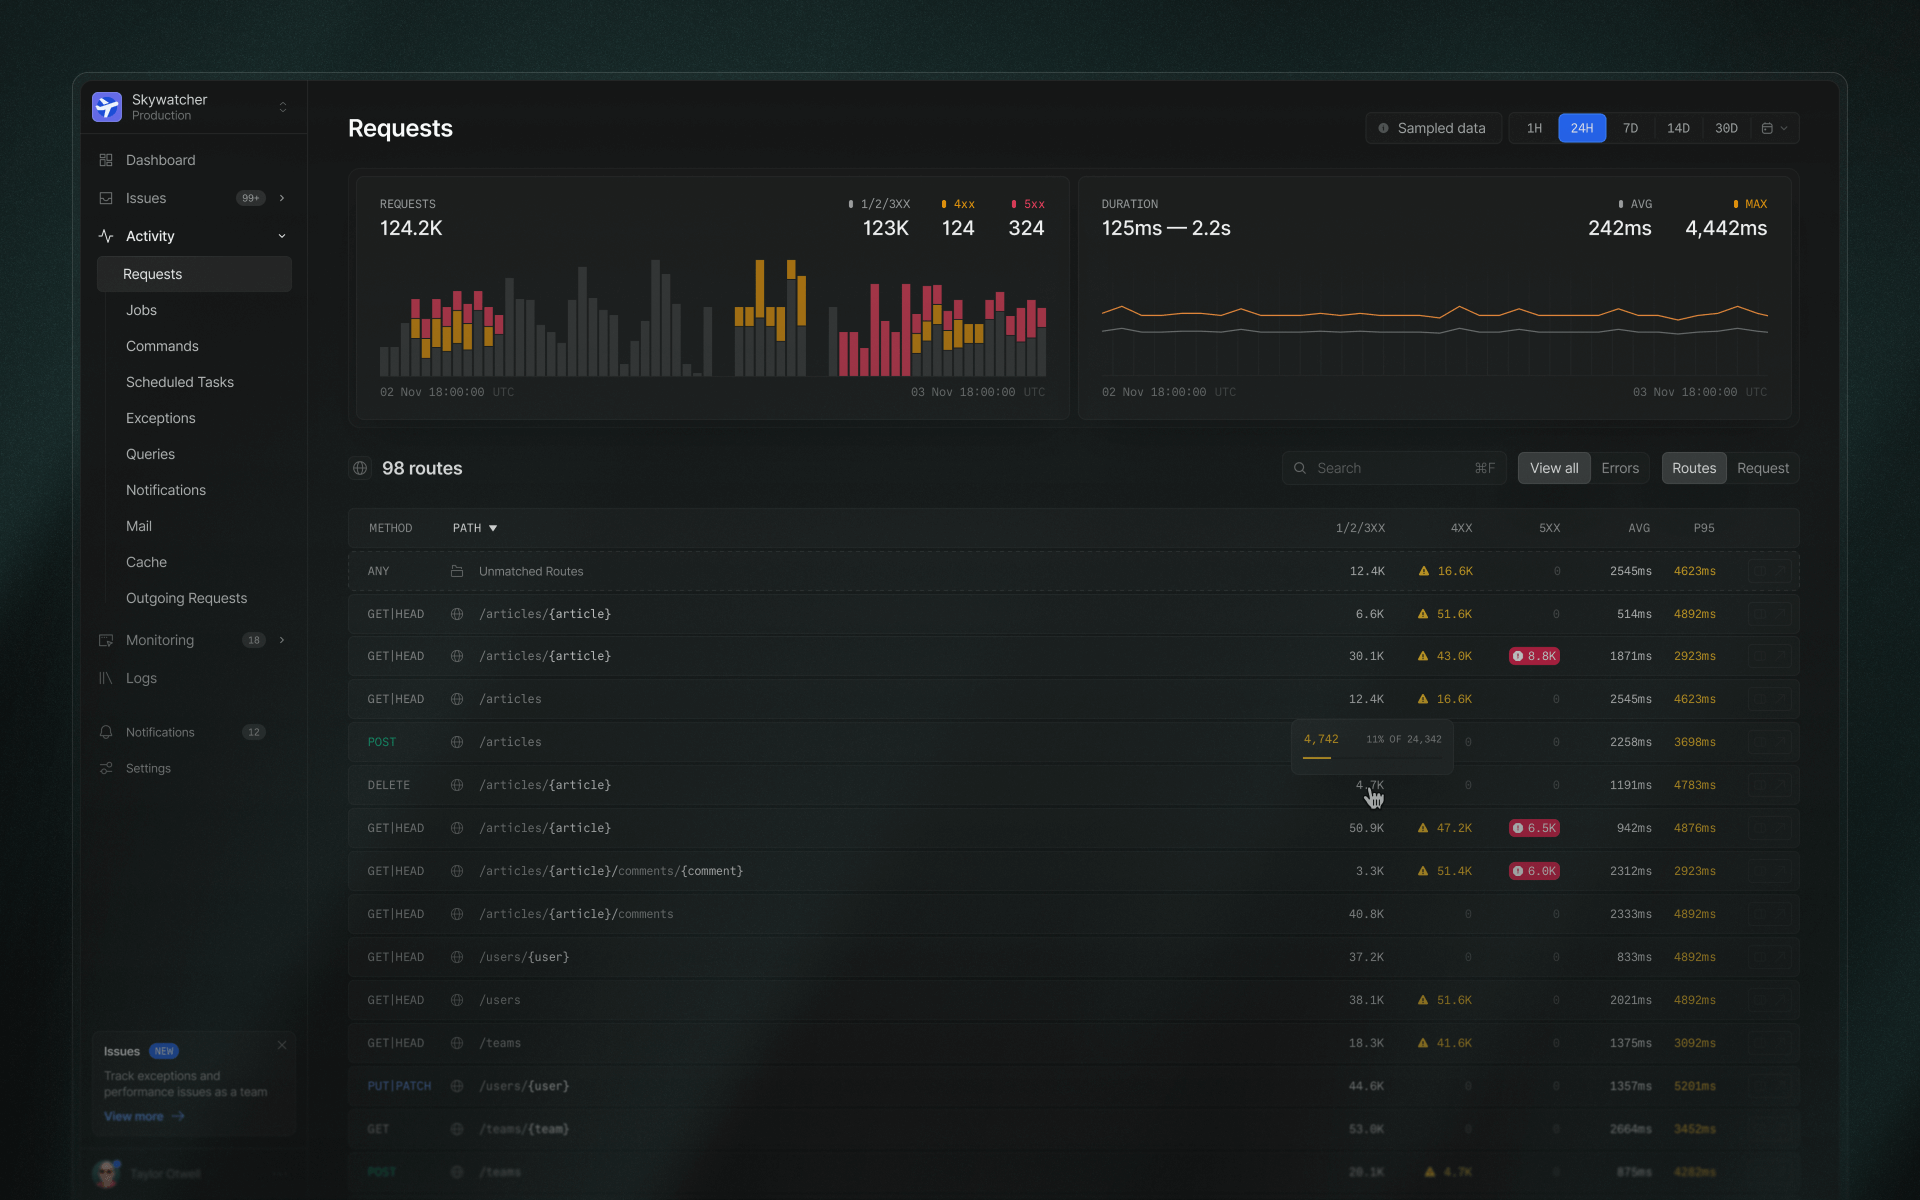
With observability at the route level, we gained a clearer picture of how people actually use Forge. Nightwatch gave us a better understanding of how people actually use Forge:
- The broadcasting authorization endpoint (used by Laravel Echo) emerged as the most-hit route, far exceeding internal expectations.
- Other API routes, especially those triggered by frontend polling, showed unexpectedly high traffic volumes.
- Meanwhile, 560 out of 726 defined routes saw active usage, giving us a clear view of what’s critical and what might be due for cleanup. This insight now informs how we prioritize features, documentation, and UI improvements.
Practical Improvements We Made
All of this intelligence (performance data, route metrics, job behavior) translated into real engineering wins. We rolled out targeted rate limiting on endpoints prone to abuse. We rewrote or cached expensive queries that quietly consumed too many resources. Our queue workers became more efficient thanks to better retry logic and failure visibility.
Nightwatch helped us focus on what mattered most, and it did so without requiring a single custom dashboard or script.
Key Monitoring Takeaways for Laravel Developers
But perhaps the biggest lesson from this experience is that monitoring isn’t just for ops teams; it’s how you build better applications. When you can see what’s happening in production, you can make smarter decisions, fix issues faster, and ship more confidently.
Here are our main takeaways from dogfooding Nightwatch on Forge:
- Laravel-native observability is a game-changer. Nightwatch speaks Laravel’s language: It understands jobs, queues, routes, events, cache layers, and exceptions out of the box. That tight integration means fewer blind spots and richer, more relevant insights.
- Production always holds surprises. Even with a mature, battle-tested app like Forge, Nightwatch surfaced patterns and edge cases we hadn’t seen before. Good monitoring doesn’t just confirm your assumptions. In fact, it challenges them.
- Faster detection means faster resolution. Real-time visibility helped us dramatically reduce our mean time to resolution (MTTR), especially during incidents. Seeing what went wrong as it happened changed how we respond to issues.
- Timeline views are essential for debugging. Nightwatch's request timeline showed us the full lifecycle of every interaction, from controller logic to database queries to queue jobs. That end-to-end view turned complex debugging sessions into straightforward fixes.
If you’re building serious Laravel applications, investing in real observability shouldn’t be optional. Deep observability will help you scale responsibly and serve users better.
Don’t Be Afraid of the Dark, Turn On Nightwatch
After two months of running Nightwatch on Laravel Forge, we no longer consider it a monitoring tool. It’s infrastructure. Nightwatch quietly ingested 2.76 billion events, provided critical insights into performance, jobs, caching, and security, and helped us fix issues before they became user-visible problems.
Looking ahead, we plan to expand our use of Nightwatch across other Laravel products and continue refining our use of data to drive architectural decisions.
Our advice for anyone building with Laravel at scale is simple: Don’t be afraid of the dark. Conquer it. More than monitoring our app, Nightwatch made us better Laravel developers. You can now be a better one, too. Try Nightwatch for free.
This blog post was inspired by two talks at Laracon AU 2024 and Laracon EU 2025. For more details, be sure to check them out.